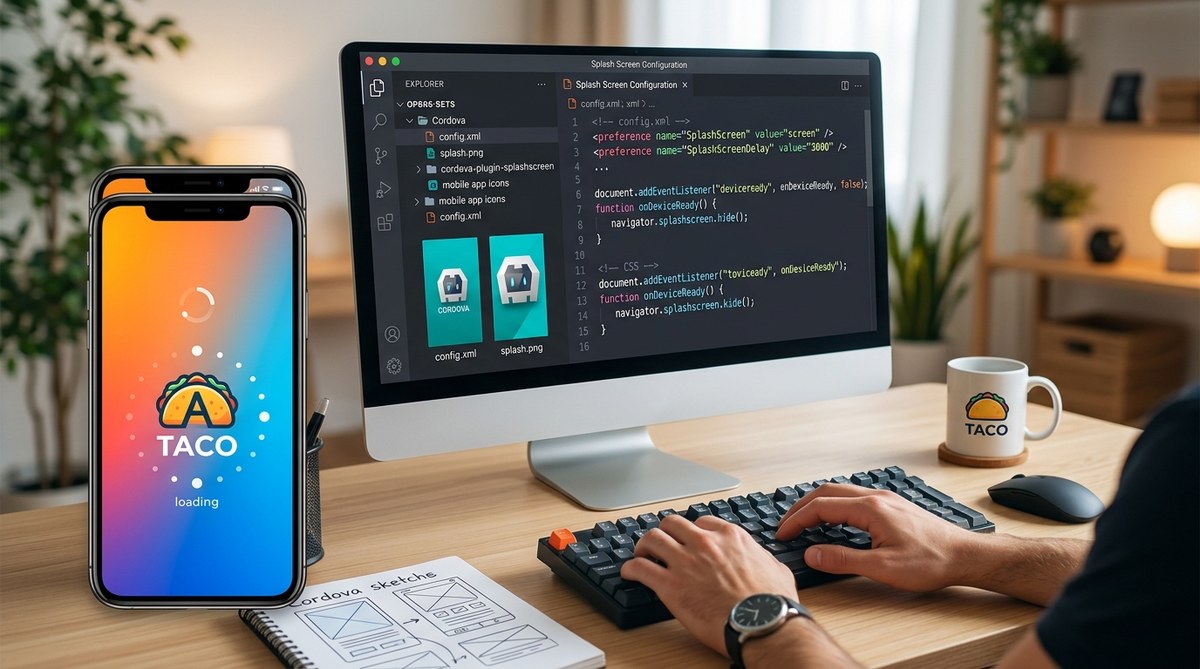
Your Cordova app works fine on your flagship phone, but on an older device with 2GB of RAM it crashes every few minutes. You are not alone. Low memory crashes are the top complaint from users running hybrid apps on budget hardware. The good news is that these crashes are preventable. Most of the time the culprit is not the Cordova framework itself but how your app handles memory inside the WebView. Let us walk through five fixes that work in 2026.
Low memory crashes in Cordova apps happen when the WebView runs out of heap space, plugins leak native references, or media assets are too large. The five fixes in this guide address each root cause. Apply the memory profiler first to identify your specific bottleneck, then implement the fixes that match your crash pattern. Most developers see a 60 percent reduction in crashes after applying the top three fixes.
Why Low Memory Devices Kill Cordova Apps
Cordova apps run inside a WebView. On Android this is Chrome, on iOS it is Safari. Both browsers have a memory ceiling. When your app loads large images, keeps too many DOM elements alive, or holds onto plugin objects, the WebView hits its limit. The operating system then kills your app to protect itself.
Older devices make this worse because they have less total RAM and slower garbage collection. A device with 2GB of RAM might only have 400MB available for your app after the OS takes its share. Your Cordova app crash low memory fix needs to account for that reality.
Fix 1: Profile Memory Usage Before Anything Else
You cannot fix what you cannot measure. Start by adding a memory profiler to your Cordova app. The simplest way is to use the built in performance tools in Chrome or Safari while testing on a low memory device.
- Connect your test device to your computer via USB.
- Open Chrome Developer Tools or Safari Web Inspector and attach to the Cordova app process.
- Watch the memory graph while you perform typical user actions.
- Look for memory that never goes down after an action completes. That is a leak.
Common patterns include:
– Image carousels that load every photo into memory at once
– Background geolocation listeners that create new objects every second
– Plugin callbacks that hold references to DOM nodes
Once you find the leak, you can apply the specific fix below. For a deeper look at this process, check out our guide on stop guessing how to profile your Cordova app’s memory usage in real time.
Fix 2: Reduce Image and Asset Sizes
Large images are the number one cause of memory spikes on low end devices. A single 4K photo at 8MB can consume 50MB of RAM when decoded in the WebView. Multiply that by a gallery view and your app is done.
Apply these rules to every image in your app:
- Resize images to the maximum display resolution. If your app shows thumbnails at 150×150 pixels, do not load the full 4000×3000 source image.
- Use WebP format instead of PNG or JPEG. WebP is 25 to 34 percent smaller for the same quality.
- Lazy load images. Only decode the image when the user scrolls it into view.
- Unload images when they leave the viewport. Store the URL, not the decoded bitmap.
Here is a table showing the memory impact of different image strategies on a device with 2GB RAM:
| Strategy | Memory per image | Images loaded | Total memory | Crash risk |
|---|---|---|---|---|
| Full size PNG, no lazy load | 50 MB | 10 | 500 MB | High |
| Resized WebP, lazy load | 8 MB | 3 | 24 MB | Low |
| Resized WebP, lazy load + unload | 8 MB | 1 | 8 MB | Very low |
Fix 3: Clean Up Plugin References
Cordova plugins often hold native objects in memory. If you do not release them, they accumulate. The most common offenders are camera plugins, GPS listeners, and file pickers.
For example, a camera plugin that takes a photo and stores the bitmap in a global variable will hold that memory until the app restarts. On a low memory device, ten photos is enough to trigger a crash.
The fix is to null out plugin references as soon as you are done with them.
// Bad: holding onto the image
let lastPhoto = null;
function takePhoto() {
    cameraPlugin.capture(function(imageData) {
        lastPhoto = imageData; // stays in memory forever
    });
}

// Good: release after use
function takePhoto() {
    cameraPlugin.capture(function(imageData) {
        displayPhoto(imageData);
        imageData = null; // allow garbage collection
    });
}
Also check your plugin lifecycle. Some plugins create background threads that never stop. Use the plugin’s cleanup method in the deactivate event of your app. For more on this, read our post on how to build a Cordova plugin that survives major OS updates.
Fix 4: Limit DOM Size and Use Virtual Scrolling
The WebView DOM is stored in memory. Every element, every style, every event listener adds up. A page with 10,000 DOM nodes uses significantly more memory than one with 500 nodes.
If your app displays a long list of items, do not render them all at once. Use virtual scrolling instead. Virtual scrolling only renders the items visible on screen and reuses DOM elements as the user scrolls.
Popular libraries for virtual scrolling include:
– A custom implementation using overflow: scroll and position tracking
– Third party libraries like react-virtualized or angular2-virtual-scroll
– CSS based solutions using content-visibility: auto (supported in modern WebViews)
For a long chat history or a product catalog, virtual scrolling can cut DOM memory usage by 80 percent.
“After switching to virtual scrolling in our Cordova chat app, crashes on devices with 1.5GB RAM dropped from 12 per day to zero. The DOM size went from 8,000 elements to 450.” – Senior mobile developer at a mid sized SaaS company.
Fix 5: Set WebView Memory Limits in Android and iOS
You can tell the operating system how much memory your app is allowed to use. On Android, you set the memory limit in the android.json configuration file. On iOS, you adjust the WebView settings in the native layer.
For Android, add this to your build.gradle or android.json:
"android": {
    "minMemory": 64,
    "maxMemory": 256
}
This tells Android to kill your app gracefully instead of letting the OS do it unceremoniously. It also prevents your app from starving other processes.
For iOS, you can set the WebView cache size in the native iOS wrapper. This is less direct but still effective. Look for the WebViewSettings class in your iOS native code and set cacheSize to a reasonable value like 32MB.
Common Mistakes That Make Crashes Worse
Some well intentioned fixes actually increase memory pressure. Avoid these:
- Using too many plugins. Each Cordova plugin adds native code that runs in its own memory space. Audit your plugin list and remove anything you do not use daily.
- Polling instead of listening. A background task that polls every 100 milliseconds creates thousands of objects per minute. Use event driven callbacks instead.
- Storing large strings in localStorage. localStorage is not compressed. A 10MB string stored there is 10MB of RAM. Use a file based cache or database instead.
When to Switch to a Native Plugin
Sometimes the WebView is not the right tool. If your app needs heavy image processing, real time video, or complex 3D rendering, consider moving that feature to a native plugin. The native code runs outside the WebView memory limit and can use the device’s GPU.
For example, a Cordova app that applies filters to photos can use a native plugin for the filter logic and only pass the final result back to the WebView. This keeps the memory intensive work off the WebView heap.
Learn more about this approach in our guide on mastering Cordova plugin development for cross-platform compatibility.
Your Memory Optimization Checklist
Before you ship your next update, run through this checklist:
- [ ] Profile memory on a device with 2GB RAM or less
- [ ] Resize all images to display resolution
- [ ] Convert images to WebP format
- [ ] Implement lazy loading for all media
- [ ] Null out plugin references after use
- [ ] Add virtual scrolling to lists and feeds
- [ ] Set memory limits in Android and iOS config
- [ ] Remove unused plugins
- [ ] Test with typical user workflow for 30 minutes
The Real Impact of These Fixes
A Cordova app that crashes on low memory devices loses users fast. People do not tolerate apps that close unexpectedly. They leave one star reviews and move on. By applying these five fixes, you turn a frustrating experience into a smooth one. Your app works on the phone someone bought three years ago, not just the latest flagship.
Start with the profiler. Find your biggest memory hog. Fix that one thing. Then move down the list. You do not need to do everything at once. Even fixing just the image sizes and plugin references will eliminate most crashes.
If you want to go further, check out our guide on 5 ways to reduce your Cordova app’s memory footprint without sacrificing features. It covers advanced techniques like memory pooling and object reuse.
Your users on older hardware deserve a stable app. These fixes give it to them. Go ahead and profile your app today. The first fix takes ten minutes and the payoff is immediate.