Building a Cordova application is exciting, but when bugs pop up, they can feel overwhelming. Debugging hybrid Cordova apps requires a mix of tools, techniques, and best practices. Knowing how to troubleshoot effectively can save hours of frustration and help you deliver a smoother user experience. Whether you’re new to Cordova or looking to sharpen your skills, this guide offers actionable tips to help you identify and fix issues quickly.
Debugging hybrid Cordova applications is a critical skill for developers. Using the right tools, understanding platform-specific quirks, and following structured processes can drastically reduce troubleshooting time and lead to more reliable apps.
Understanding the essentials of Cordova debugging
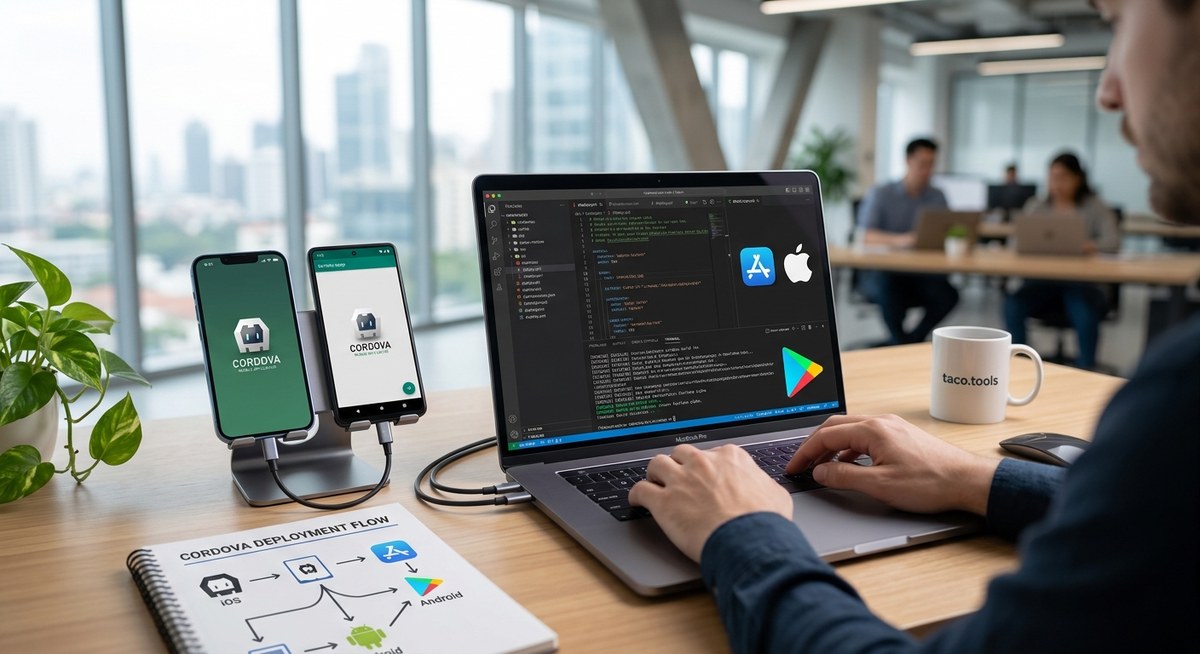
Cordova allows you to build cross-platform mobile apps using web technologies like HTML, CSS, and JavaScript. However, because it bridges web code with native devices, bugs can originate from multiple sources. Recognizing this is key to troubleshooting effectively.
Common issues include layout glitches, performance hiccups, or native plugin failures. Debugging becomes a process of isolating these problems across different environments and platforms. The good news is that Cordova supports several powerful tools that, when used correctly, make the debugging process more manageable.
How to prepare your environment for debugging
Before diving into troubleshooting, make sure your environment is set up properly:
- Install the latest version of Cordova and platform-specific SDKs (Android Studio for Android, Xcode for iOS).
- Enable developer options on your device or emulator.
- Connect your device via USB or use remote debugging tools.
Having these in place ensures you can access device logs and debugging features seamlessly.
Practical steps to debug hybrid Cordova applications
Follow this structured process to troubleshoot your app efficiently:
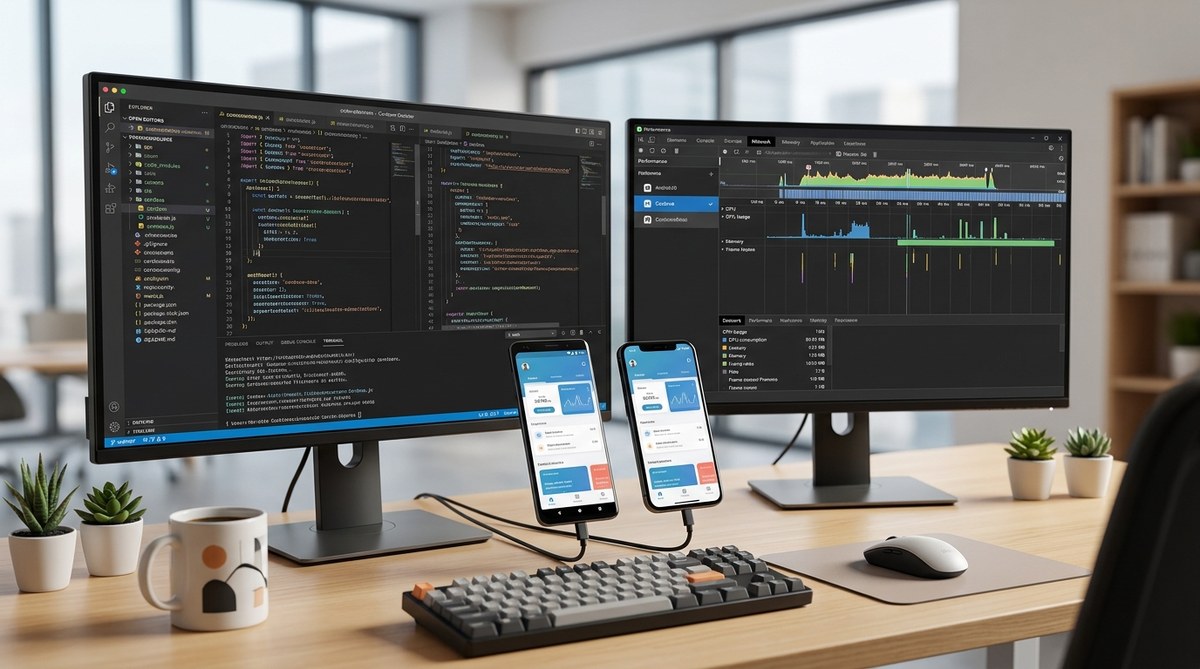
1. Use browser developer tools for quick testing
For Android, Chrome’s remote debugging features are invaluable. Connect your device, open Chrome on your desktop, and navigate to chrome://inspect. From here, you can inspect your app’s DOM, monitor console logs, and analyze network requests.
For iOS, Safari’s Web Inspector offers similar capabilities. Connect your device, enable the Web Inspector in Safari settings, and then open Safari on your desktop to access debugging tools for your app.
2. Access native logs for detailed insights
Device logs often reveal errors that don’t surface in web views. Use the Android Debug Bridge (ADB) to view logs with adb logcat. For iOS, Xcode’s console provides logs when connected via cable.
Monitoring logs during app execution helps you identify plugin failures, JavaScript errors, or native crashes. Remember to filter logs to relevant tags for clarity.
3. Debug plugins and native code issues
Plugins are often the source of bugs in Cordova apps. When facing native-related problems:
- Check plugin compatibility with your platform and Cordova version.
- Use platform-specific debugging tools like Xcode’s debugger or Android Studio’s profiler.
- Reinstall or update plugins if errors persist.
Understanding how plugins interact with native code can clarify many mysterious bugs.
4. Test across multiple devices and environments
Different devices and OS versions can introduce unique bugs. Test your app across a range of devices and emulator configurations. This helps catch platform-specific issues early. Use cloud testing services if physical devices are unavailable.
5. Record and analyze user reports
Sometimes bugs only appear in real-world usage. Implement logging within your app to record errors and user actions. Tools like Sentry or Bugsee can capture crash reports with device details and logs, speeding up diagnosis.
Best practices for effective debugging
Beyond the step-by-step process, adopting best practices enhances your troubleshooting:
- Keep your development tools updated.
- Write modular, testable code to isolate bugs.
- Use version control to track changes that introduce issues.
- Document your debugging findings to build a knowledge base.
- Regularly review plugin documentation for updates and known issues.
“Investing time in setting up a solid debugging process pays off. It transforms troubleshooting from guesswork into a systematic activity.” — seasoned Cordova developer
Common pitfalls and mistakes to avoid
| Mistake | Explanation | Solution |
|---|---|---|
| Ignoring platform-specific quirks | Bugs may only appear on certain devices or OS versions. | Test on multiple environments. |
| Overlooking plugin issues | Plugins can cause native crashes or conflicts. | Check plugin status and logs. |
| Not updating tools and dependencies | Outdated SDKs or Cordova versions can lead to incompatibility. | Keep everything current. |
| Relying solely on web view errors | Some bugs originate from native code, not visible in DOM. | Use native debugging tools. |
Tips for efficient troubleshooting
- Always reproduce bugs in controlled environments.
- Use console logs judiciously to trace execution.
- Break down complex issues into smaller parts.
- Maintain a clean build environment to avoid cache-related issues.
- Keep device logs open during testing sessions.
Final thoughts on mastering Cordova debugging
Debugging hybrid Cordova applications can seem daunting at first. But with the right tools and a disciplined approach, you can identify and fix issues faster. Embrace platform-specific debugging features, maintain updated environments, and document your findings. Over time, troubleshooting becomes more intuitive, helping you deliver stable, high-quality apps.
Remember, problems are part of development. Learning how to solve them effectively is what makes you a better developer. Keep practicing these techniques, and your debugging skills will become second nature.
Keep refining your debugging skills
Effective debugging is a continuous process. As you build more complex apps, you’ll encounter new challenges. Stay curious, keep learning, and leverage community resources and documentation. Over time, troubleshooting will become a natural part of your development workflow, leading to more reliable and polished hybrid apps.
Happy coding and debugging!